

Site speed is a technical quality baseline, not a magic ranking lever: measure Core Web Vitals with field data first, then prioritize fixes that improve LCP and INP. Run PageSpeed Insights or a real-user monitoring setup before touching code. Speed fixes cut abandonment and lift conversions, but relevant, useful content still decides most rankings.
- Focus on improving Largest Contentful Paint and Interaction to Next Paint, as they directly impact user perception and are key to good Core Web Vitals scores.
- Prioritize fixes on high-traffic landing pages, competitive query results, and crucial interaction flows like checkout or contact forms for maximum business benefit.
- Use real-user monitoring and Google’s CrUX data to measure actual visitor experience, emphasizing the 75th percentile over averages for accurate assessment.
- Implement low-effort, high-impact optimizations such as image formats, resource hints, and JavaScript deferral before advanced server upgrades.
- Avoid chasing a perfect Lighthouse score; instead, fix speed issues on pages that matter most for conversions and user engagement.
Core Web Vitals and the metrics that actually matter
Largest Contentful Paint (LCP) measures how fast the main content appears to load. Interaction to Next Paint (INP) measures how responsive a page feels when someone clicks, taps, or types. Cumulative Layout Shift (CLS) measures whether elements jump around while the page settles. These three make up Core Web Vitals, and Google's own Chrome team defines them this way for a reason: they map to what people actually notice.
A few supporting metrics round out the picture:
- Time to First Byte (TTFB) shows how fast your server responds, useful for diagnosis but not itself a Core Web Vital.
- First Contentful Paint (FCP) marks when anything visible first renders.
- Time to Interactive (TTI) estimates when a page becomes fully usable, mostly a lab concept now that INP has replaced it in field reporting.
Core Web Vitals are scored as good, needs improvement, or poor, and Google recommends judging them at the 75th percentile of visits rather than averaging them. An average hides your slowest visitors entirely, while the 75th percentile tells you what a meaningful majority actually experienced.
Why speed matters for SEO and for your bottom line
Speed functions as a quality signal, not a content substitute. When two pages target the same query with comparable relevance, the faster one often has an edge, and Web frames performance as one input among many ranking systems weigh, never a replacement for usefulness. That framing matters because too many teams chase a perfect Lighthouse score while ignoring thin or outdated content that no speed fix will rescue.
The user behavior case is more straightforward. Slow pages lose visitors before they ever see your offer, and sluggish interactions kill conversions on the pages that do load. Performance also feeds the newer layer of search: AI-generated answers and featured placements favor sources that load and respond cleanly, since a page that stalls mid-crawl or mid-render is harder to summarize reliably.
Where should you actually spend effort first:
- High-traffic landing pages where small speed gains multiply across many sessions.
- Pages in tight competitive queries where content quality is already similar across results.
- Checkout, booking, or contact flows where INP problems cost conversions directly.
How to measure site speed: lab data, field data, and the right tools
Lab tools like Lighthouse run a single simulated test on a single device and connection profile. Field data, collected through the Chrome User Experience Report (CrUX) or your own real-user monitoring, reflects what actual visitors experienced across every device and network they used. When both exist, field data should take priority because it shows reality, while lab data is best for diagnosing why a specific page is slow.
Here is a practical sequence for checking any page:
- Open PageSpeed Insights and read the field data section first. If a URL has enough CrUX traffic, you will see real 75th-percentile scores.
- Check whether PSI shows origin-level data instead of URL-level data. Low-traffic or new pages often lack individual CrUX records and fall back to origin aggregates or lab-only results.
- Scroll to the Lighthouse opportunities and diagnostics section to find specific fixes: oversized images, render-blocking scripts, excessive main-thread work.
- For deeper investigation, run the page through WebPageTest or GTmetrix. Both generate filmstrips and request-level waterfalls that show exactly which asset stalled the page and when.
- For a page with no CrUX data at all, rely on lab testing plus your own RUM implementation rather than waiting for enough traffic to populate Google's dataset.
WebPageTest in particular earns its reputation for diagnostics that summary scores can't provide. Its waterfall view shows the order resources load in, how long each one blocks, and where a single bloated third-party script derails an otherwise fast page.
When PSI shows origin-level fallback data instead of URL-specific numbers, treat your highest-traffic templates as the representative sample and test those pages directly in WebPageTest for page-specific detail.
Fixes that actually move LCP, INP, and CLS
Not every fix deserves the same urgency. Some take an afternoon, others take a sprint, and knowing which is which keeps a performance project from stalling.
For LCP, the highest-leverage, lowest-effort changes are usually image related:
- Convert hero images to modern formats like WebP or AVIF and serve correctly sized versions with
srcset. - Add
preconnectorpreloadhints for the resources that render your largest above-the-fold element. - Serve static assets through a CDN and set long cache lifetimes with proper cache-control headers.
For INP, the fixes live mostly in JavaScript behavior:
- Defer any script that isn't needed for the first interaction.
- Break long tasks into smaller chunks so the main thread stays free to respond to clicks and taps.
- Remove or delay render-blocking scripts that sit in the document head for no functional reason.
Beyond those two metrics, a handful of server and delivery changes compound everything else: enabling gzip or Brotli compression, minifying CSS, JavaScript, and HTML, consolidating redundant requests, cutting unnecessary redirect chains, and moving to HTTP/2 or HTTP/3 where your hosting supports it.
Third-party scripts deserve their own line item. Marketing tags, chat widgets, and analytics snippets are frequently the single biggest drag on both LCP and INP, and the fix is rarely removal, it's sequencing: load them asynchronously, gate them behind user interaction when possible, and audit new tags before they go live site-wide.
| Fix category | Typical effort | Primary metric affected |
|---|---|---|
| Image optimization and CDN caching | Low | LCP |
| Deferring and breaking up JavaScript | Medium | INP |
| Minification and compression | Low | LCP, FCP |
| Server or protocol upgrades (HTTP/3, backend tuning) | High | TTFB, LCP |
| Third-party script auditing | Medium | INP, LCP |
Fix the image and caching layer first. It's usually the fastest win available and buys you room to tackle the harder JavaScript work without a client watching a stalled timeline.
How to monitor results without breaking the metrics you're tracking
Measuring speed well means setting up real-user monitoring or leaning on CrUX's origin-level aggregations, then watching Core Web Vitals at the 75th percentile across your real mix of devices and connections, not just the one you tested on.
- Report every Core Web Vital at the 75th percentile, and check the 90th or 95th percentile separately if a meaningful share of your traffic is on slow mobile connections.
- Version every deployment in your analytics so you can trace a regression back to a specific release instead of guessing.
- Run changes as controlled experiments before a full rollout, since a site-wide tagging change that quietly hurts INP is hard to catch after the fact.
The instrumentation itself can become part of the problem. Developer guidance on field measurement recommends sending data asynchronously, using sendBeacon() for the final payload, and scheduling non-urgent work with requestIdleCallback() so your measurement code never competes with the content it's measuring. A blocking analytics snippet can quietly damage the LCP and INP numbers it was installed to track.
Build performance checks into your deploy pipeline rather than checking manually after launches, so a regression in a build gets flagged before it reaches visitors.
What we see go wrong on service and local business sites
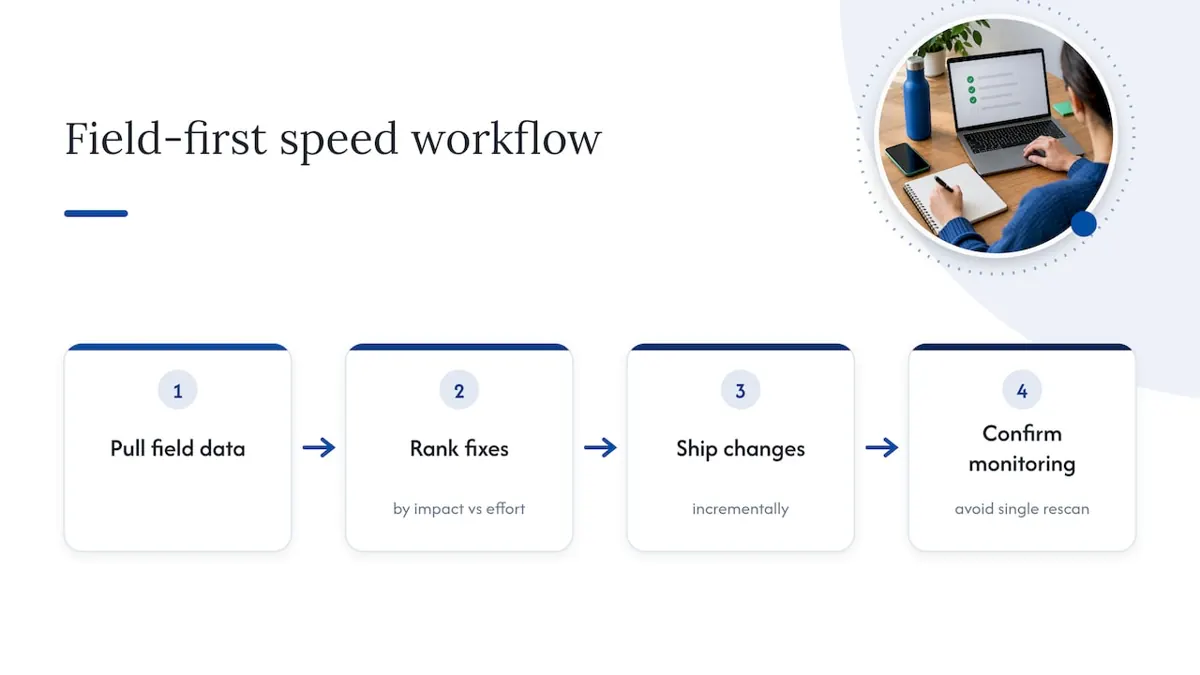
A dependable workflow holds up across site types: pull field data, rank fixes by impact versus effort, ship changes incrementally, then confirm with monitoring rather than a single rescan. The repeat mistakes we run into are blocking analytics scripts, teams treating a one-time Lighthouse score as if it were real-user truth, and site-wide tag rollouts pushed live with no experiment to catch a regression.
The speed obsession misses the point most teams actually need to hear
Most site speed advice treats the Lighthouse score as the finish line, and that's backward. A 100 on a lab test tells you almost nothing about whether your actual visitors, on actual phones, over actual mid-tier mobile connections, had a decent experience. Field data is less flattering and far more honest, which is exactly why it gets ignored.

The bigger miss is sequencing. Teams pour weeks into shaving 200 milliseconds off LCP on a page that converts at a fraction of a percent, while ignoring an INP problem on the booking form that's losing leads every single day. Speed work should follow the money: fix the pages and interactions your business actually depends on before chasing a clean scorecard everywhere else.
Mobile makes this sharper, not softer. Most local and service-business traffic now arrives on a phone over an inconsistent connection, so a desktop-only check tells you almost nothing useful. If your field data splits by device, read the mobile segment first.
One more thing worth saying plainly: speed will not rescue weak content or a confusing offer. It removes friction. It doesn't create a reason to buy.
Where NSYGHT fits if you'd rather not do this alone
Technical audits, Core Web Vitals monitoring, and performance-minded builds are part of how we approach SEO for local and multi-location businesses, alongside the content and authority work that speed alone can't replace. When a rebuild is the real fix, not a patch, our SEO-native website design work starts with performance as a requirement, not an afterthought.

If your field data is telling a story you'd rather not read alone, request an audit through our SEO services page and we'll walk through what's actually worth fixing first.
Frequently Asked Questions
Site speed in SEO refers to how quickly a page loads and responds, measured through Core Web Vitals like LCP, INP, and CLS. Search systems treat it as a technical quality signal that supports, but never replaces, relevant content.
Speed acts as a tiebreaker among pages that already satisfy a search intent similarly well, rather than a dominant ranking factor on its own. Google's own guidance frames performance as one signal among many, with real impact concentrated in close competitive matchups and in user behavior like abandonment and conversion.
A good result means your Core Web Vitals fall in the "good" threshold at the 75th percentile of real visits, not just in a single lab test. That means most of your actual traffic, across the devices and connections people really use, is getting a fast, stable, responsive experience.
Start with field data from PageSpeed Insights or real-user monitoring to find out what's actually slow for real visitors. Then prioritize low-effort, high-impact fixes first, like image optimization and caching for LCP, and deferred or reduced JavaScript for INP, before tackling bigger server-level projects.